June 08, 2005
A Practical Example


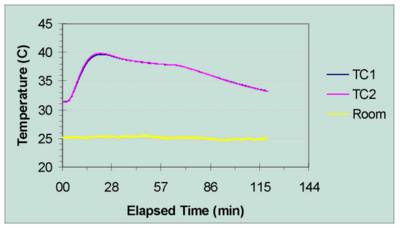
Remeber my article on process monitoring? I thought it would be better to give a practical example of a case of temperature monitoring. The latest addition to my high-pressure adsorption rig is a thermocouple datalogger - a small USB device that will convert the thermocuple voltage signal in digital form that can be understood by the appropriate software. Data can then be exported to Excel (or another other spreadsheet) and plotted (the quality of the picture may not be the best: the conversion to JPG introduced a little distortion).
The core of the adsorption system (the two pressure vessels, control valves and related piping) is inside an oven for temperature control, and the violet and blue tracks represent the temperature inside the two pressure vessels (in this case, the system was filled with carbon dioxide and possibly some air at atmospheric pressure). The yellow track represents the room temperature.
The room temperature is constant within 1 C, but shows short-period small oscillations: this happens because the thermocouple is small and highly sensible, and the recording device has a high resolution.
When the oven thermostat is set at 40 C, the temperature rises quickly, overshoots slightly the setpoint and then slowly settles. When the heating is turned off, temperature decreases slowly and almost linearly. One can notice that the tracks of the inner temperature are considerably smoother: the oven is insulated, and the metal of the vessels, tubes, valves, fittings and supports constitutes a sizable thermal mass that dampens effectively small temperature fluctuations. Also, low-pressure (and thus low-density) gases are not good thermal conductors.
Comments:
Post a Comment


